Metrics
Metrics
CloudStation provides comprehensive metrics to help you monitor and optimize the performance of your applications. This guide will explain what metrics are, why they are important, and how to use them effectively.
What are Metrics?
Metrics are quantitative measurements that provide insights into the performance and health of your applications. They help you understand how your applications are behaving and identify areas for improvement.
Why are Metrics Important?
Metrics are important for several reasons:
- Performance Monitoring: Metrics allow you to monitor the performance of your applications in real-time.
- Troubleshooting: By analyzing metrics, you can identify and troubleshoot issues quickly.
- Optimization: Metrics provide data that can help you optimize your applications for better performance and efficiency.
- Capacity Planning: Metrics help you plan for future capacity needs by understanding current usage patterns.
Viewing Metrics
To view metrics for your applications:
- Navigate to Profile Settings.
- Select Resource Metrics.
- Here, you can see various metrics related to your applications, such as CPU usage, memory usage, and network traffic.
- Use the filters and time range selectors to customize the metrics view according to your needs.
Key Metrics
Some of the key metrics you can monitor include:
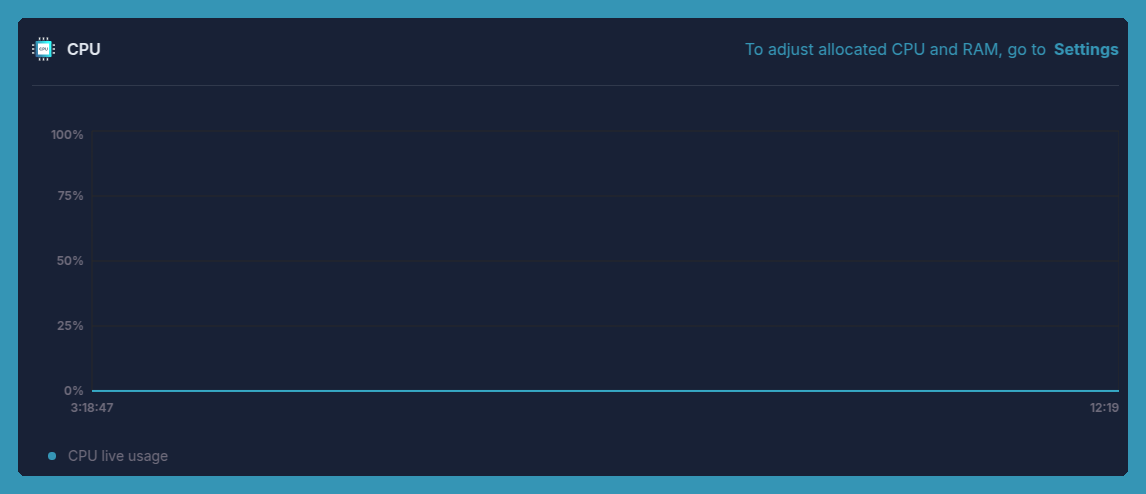
- CPU Usage: Measures the amount of CPU resources your application is using. This includes live CPU usage.
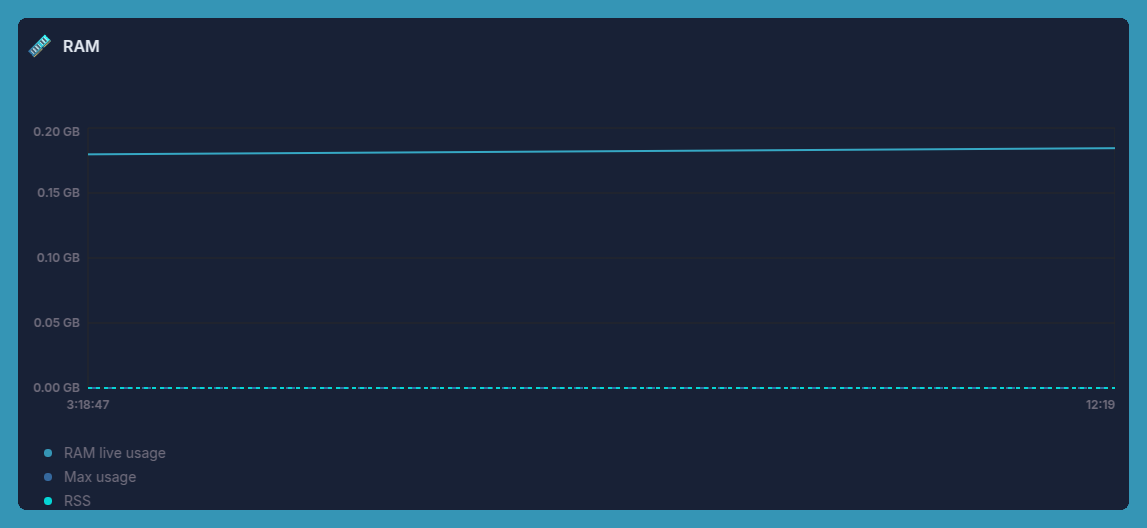
- Memory Usage: Tracks the memory consumption of your application, including live RAM usage, max usage, and RSS (Resident Set Size).
- Network Traffic: Monitors the amount of data being sent and received by your application.
- Disk I/O: Measures the read and write operations on your application's storage.
Tips
- Set Alerts: Configure alerts for critical metrics to get notified when thresholds are exceeded.
- Regular Monitoring: Regularly monitor your metrics to ensure your applications are performing optimally.
- Analyze Trends: Use historical data to analyze trends and make informed decisions about scaling and optimization.
Use Cases
- Performance Optimization: Use metrics to identify performance bottlenecks and optimize your application.
- Capacity Planning: Analyze usage patterns to plan for future capacity needs.
- Troubleshooting: Quickly identify and resolve issues by monitoring key metrics.
FAQs
How do I access metrics for my applications?
Go to Profile Settings > Metrics to view metrics for your applications.
Can I set up alerts for specific metrics?
Yes, you can configure alerts for specific metrics to get notified when thresholds are exceeded.
What should I do if I notice high CPU or memory usage?
If you notice high CPU or memory usage, investigate the underlying cause and optimize your application to reduce resource consumption.
For more details, visit our metrics page.
Support
If you have any questions or need assistance, please contact our Support Team.
Edit this file on GitHub