

Instances
Learn how to deploy and manage cloud services with CloudStation Instances
Instances are your deployed cloud services running on CloudStation's infrastructure. Each instance runs in its own secure container and can communicate with other instances in your project through a secure network.
The Instances Page
When you open a project, you land on the Instances tab by default. The page displays:
- Project name as the page title (e.g., "YOUTUBE")
- Subtitle: "View and manage cloud instances for this project."
- Three tabs: Instances (default), Kanban, and Schedules
- View toggles: List and Diagram buttons in the top-right
- + Add button: Dropdown for adding new services
- Guide button: Help button in the bottom-right corner
Types of Instances
CloudStation organizes your services into two categories:
Images (Docker-based)
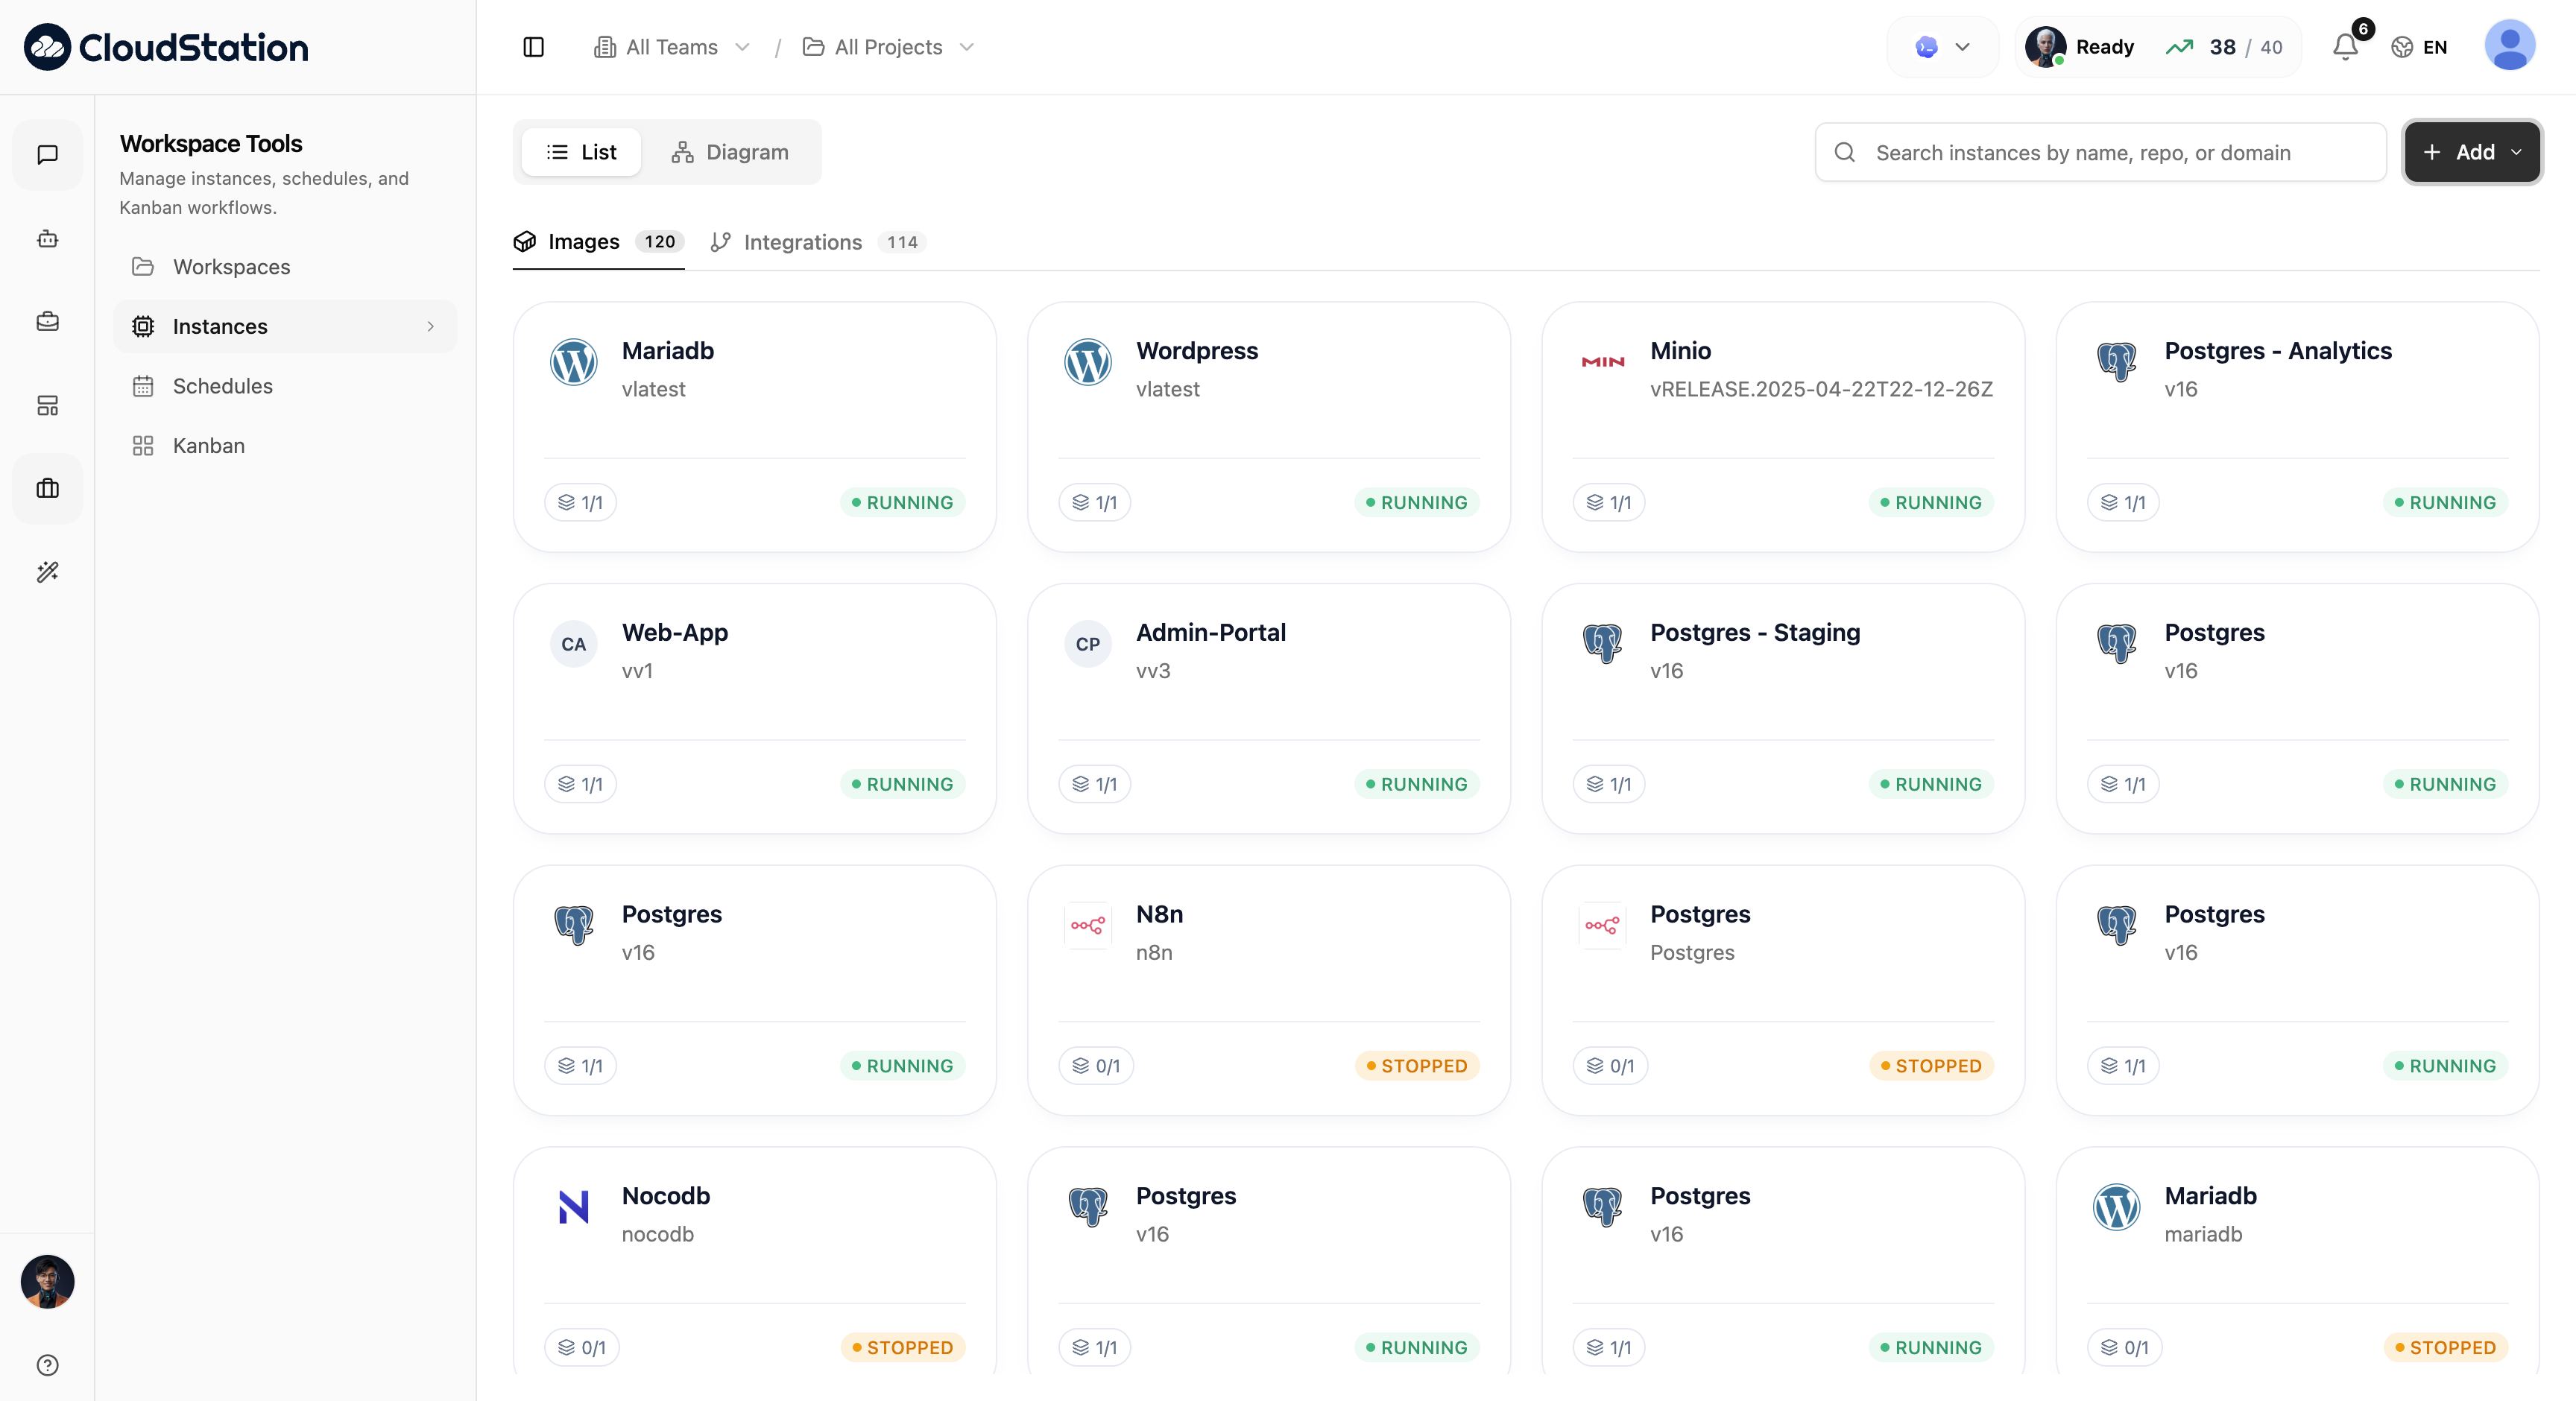
The Images section displays Docker-based services with a service count (e.g., "13 services"). These include:
- Pre-built Docker images from Docker Hub
- Container registry images
- CloudStation template services (databases, caches, etc.)
Each card shows:
- Service icon/logo
- Name of the service
- Version or status description (e.g., "v16", "Running smoothly — no issues detected")
- Replica count (e.g., "1/1")
- Status badge with color indicator
Integrations (Git-based)
The Integrations section shows Git-connected services with a service count (e.g., "11 services"). These deploy directly from:
- GitHub repositories
- GitLab repositories
- Bitbucket repositories
Each card shows the same information as Images, plus:
- Branch name (e.g., "main", "master")
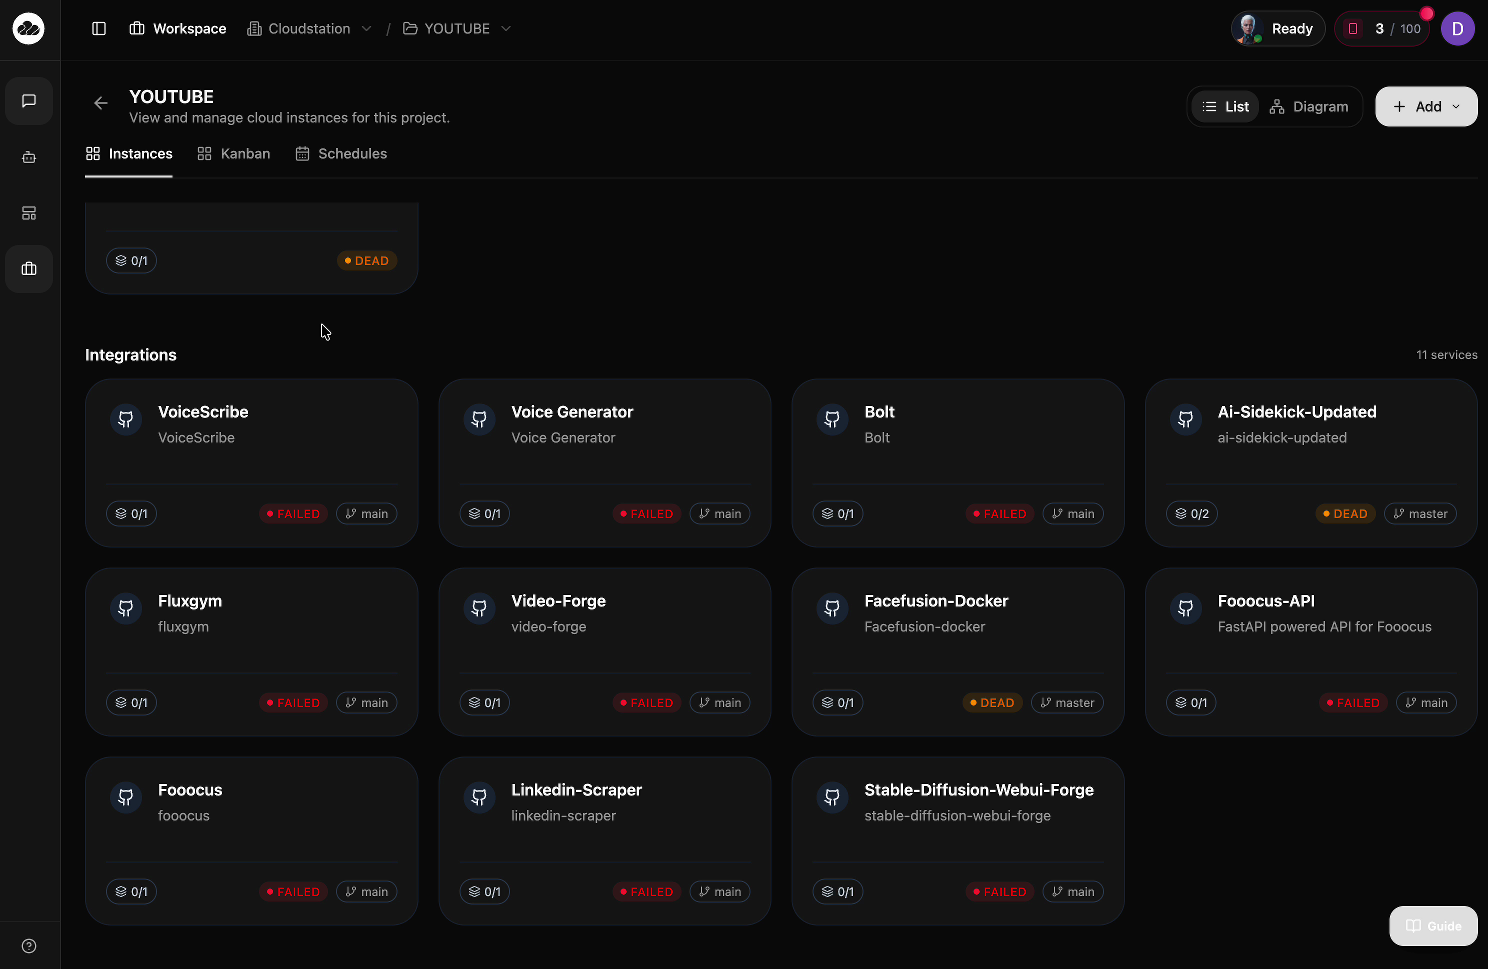
CloudStation automatically builds and deploys your code whenever you push changes to the connected branch.
Service Status
Every instance displays a real-time status indicator:
| Status | Indicator | Description |
|---|---|---|
| RUNNING | Green dot | Service is active and healthy |
| DEAD | Red dot | Service has terminated (replicas show 0/1) |
| FAILED | Red dot | Service deployment failed |
Check the replica count to quickly assess service health. A running service shows "1/1" while a dead service shows "0/1".
Instance Detail Panel
Click any instance to open a slide-out panel on the right side of the screen.
Header
- Instance name and current status (Running/Dead)
- Action buttons: Deploy, Restart, Stop, Delete (trash icon)
Tabs
The detail panel has five tabs:
- Overview - Service status, endpoints, and resource information
- Variables - Environment variables configuration
- Deploys - Deployment history and status
- Logs - Real-time and historical logs
- Settings - Service configuration options
Adding New Services
Click the + Add button in the top-right corner to deploy a new service. You can choose to:
- Deploy from a Docker image
- Connect a Git repository
- Use a pre-configured template
View Options
Toggle between two views using the buttons in the top-right:
- List: Card grid layout (4 columns) showing all services
- Diagram: Visual topology showing service connections
Next Steps
- View your instances - Learn about List and Diagram views
- Deploy a new service - Get your first service running
- Configure environment variables - Set up your service configuration
- Manage volumes - Configure persistent storage
- Monitor your services - Keep your services healthy