

Monitoring
Monitor your CloudStation instances with real-time status indicators and log streaming to keep your services running smoothly.
Service Status Indicators
Every instance displays a real-time status indicator showing its current state.
Status Types
RUNNING (Green)
- Service is active and healthy
- Replicas show as 1/1
- Operating normally
DEAD (Red)
- Service has been terminated
- Replicas show as 0/1
- Container is no longer running
FAILED (Red)
- Deployment or runtime failure occurred
- Service could not start or crashed
- Check logs for error details
Status updates in real-time without refreshing the page. CloudStation continuously monitors your services and reflects changes instantly.
Viewing Logs
Logs help you understand what is happening inside your instances and diagnose issues.
Accessing Logs
Click your instance to open the details panel
Select the Logs tab
View real-time log output from your service
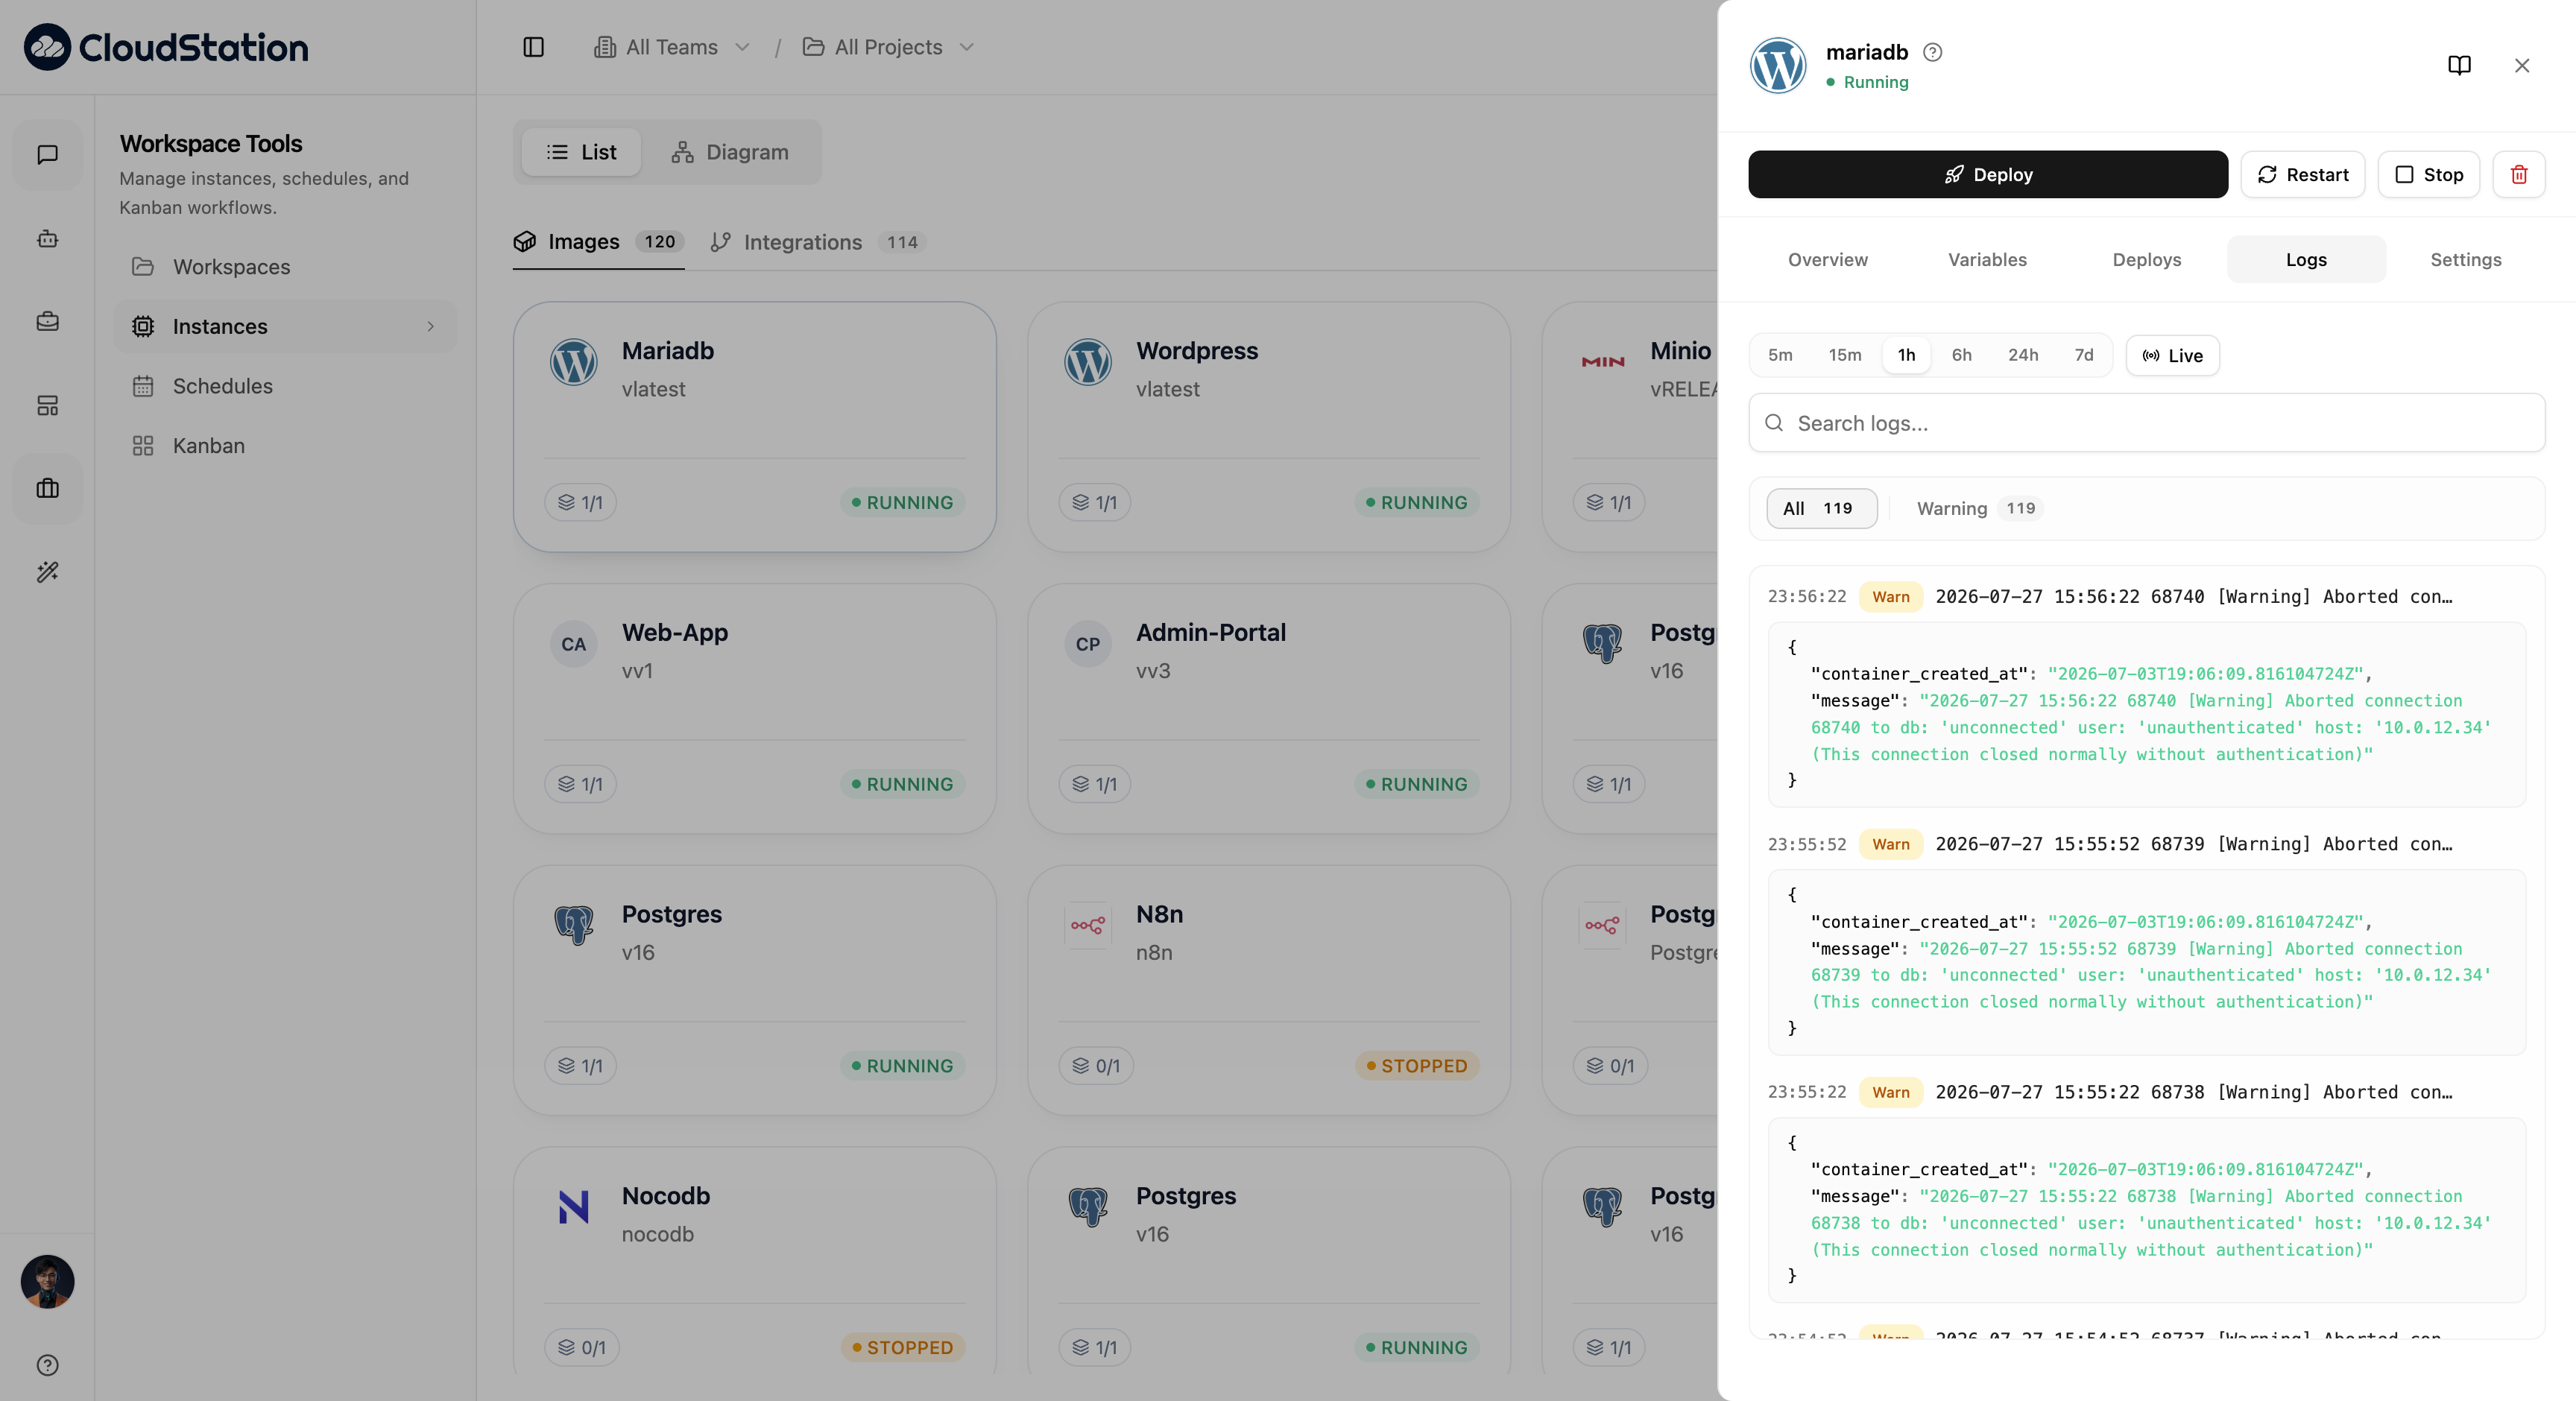
Time Range Filters
Filter logs by time period using the buttons along the top:
- 5m - Last 5 minutes
- 15m - Last 15 minutes
- 1h - Last hour
- 6h - Last 6 hours
- 24h - Last 24 hours
- 7d - Last 7 days
- Live - Stream logs in real-time
Search Logs
Use the search bar to filter log entries by keyword. Type in the "Search logs..." field to find specific entries.
When troubleshooting, start with the Live view to see current activity, then switch to a longer time range if you need to investigate past events.
Instance Actions
Manage your instances using the action buttons in the detail panel header.
Available Actions
- Deploy - Redeploy the service (primary button with rocket icon)
- Restart - Restart the running container
- Stop - Stop the service
- Delete - Remove the instance (trash icon)
When to Use Each Action
Use Deploy when:
- You have pushed new code to your repository
- You want to pull a newer version of a Docker image
- Configuration changes require a fresh deployment
Use Restart when:
- Service is unresponsive but code has not changed
- You need to clear application state
- Memory issues are suspected
- Database connection pool needs refreshing
Use Stop when:
- You need to temporarily disable a service
- Performing maintenance that requires the service to be offline
- Reducing resource usage during inactive periods
Restarting or stopping a service causes brief downtime. Plan accordingly for production services.
Troubleshooting Common Issues
Service Shows FAILED Status
Debugging steps:
Open the Logs tab and check for error messages
Verify environment variables are set correctly
Ensure ports are configured properly
Check resource allocation (may need more RAM/CPU)
Service Shows DEAD Status
The service has been terminated. Common causes:
- Manual stop was initiated
- The container process exited
- Resource limits were exceeded
To recover, click Deploy or Restart to bring the service back online.
Service Running But Not Responding
If status shows RUNNING but the application is not working:
Check port configuration matches your application
Review logs for request handling errors
Verify your application is listening on the correct port
Check for slow startup or initialization issues
Logs Show No Output
If you see "No logs found":
- The service may not have started yet
- The application may not be writing to stdout/stderr
- Try selecting a different time range
- Check if the service has crashed before producing logs
Ensure your application writes logs to stdout and stderr. CloudStation captures these streams automatically.
Logging Best Practices
What to log:
- Application startup and shutdown
- Errors and exceptions with context
- Important business events
- Request failures or slow responses
What NOT to log:
- Passwords or API keys
- Personal user data (PII)
- Session tokens or credentials
- High-frequency debug messages in production
Next Steps
- Configure environment variables - Set up logging configuration
- Add volumes - Ensure data persists across restarts
- Deploy services - Launch new instances
- View instances - Monitor your infrastructure visually